Through 2/2/2025 (for EPU):
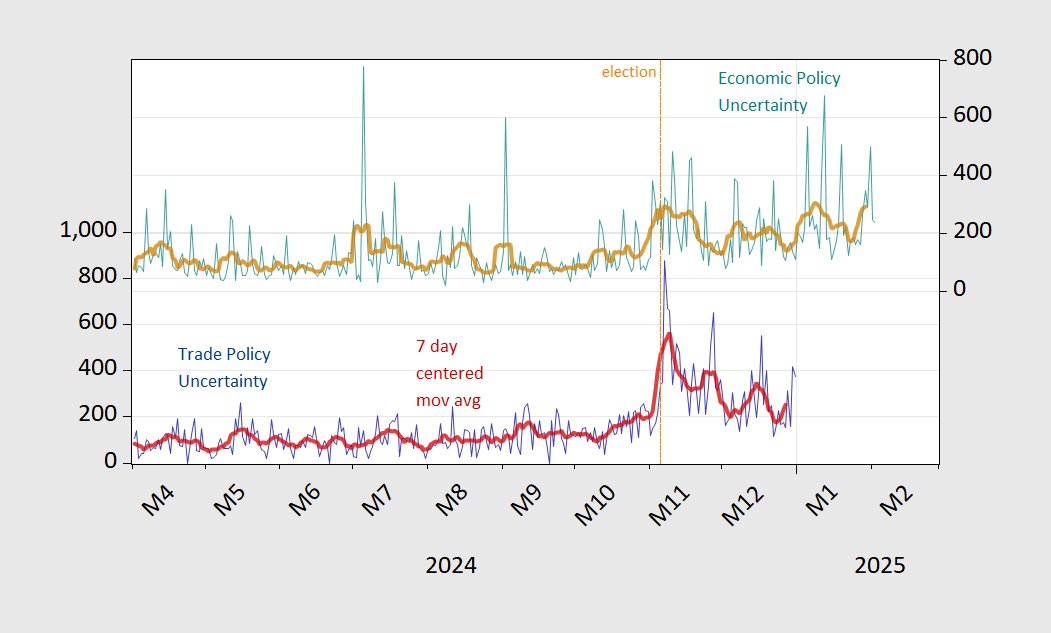
Figure 1: Trade Policy Uncertainty (blue, left scale), 7 day centered moving average (redb, left scale), Economic Policy Uncertainty (green, right scale), 7 day centered moving average (tan, right scale). Source: policyuncertainty.com, matteoiacoviello.com.