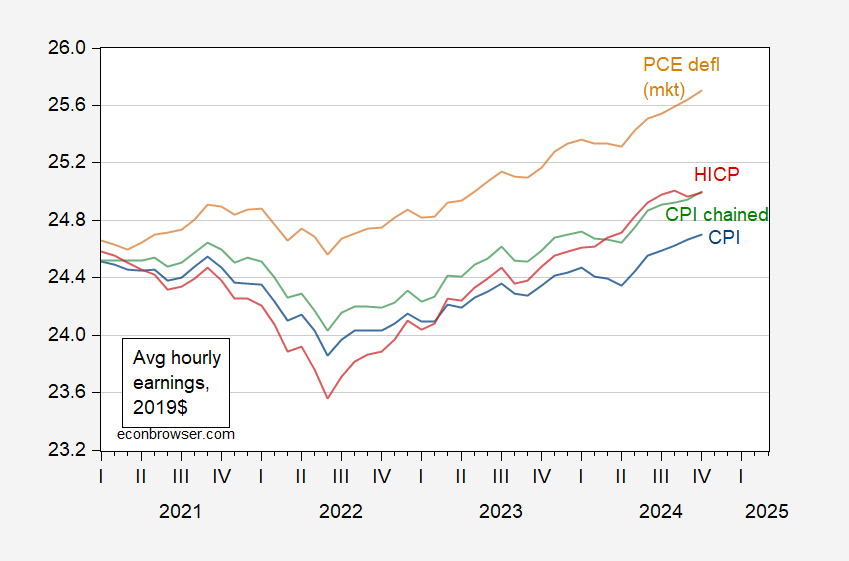
A comparison between CPI, chained CPI, PCE price index, and HICP deflation:
Figure 1: Average hourly earnings, CPI deflated (blue), chained CPI deflated (green), PCE price index – market based deflated (tan), and HICP deflated (red), all in 2019$. Chained CPI, HICP deflated by author using X-13. Source: BLS, BEA, European Commission.
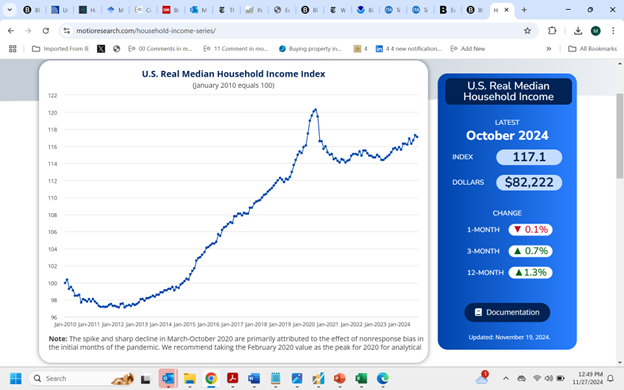
Estimated real median income through October, from MotioResearch.
I discuss consumption and the consumption outlook in light of income and inflation trends with Justin Ho on Marketplace today.


