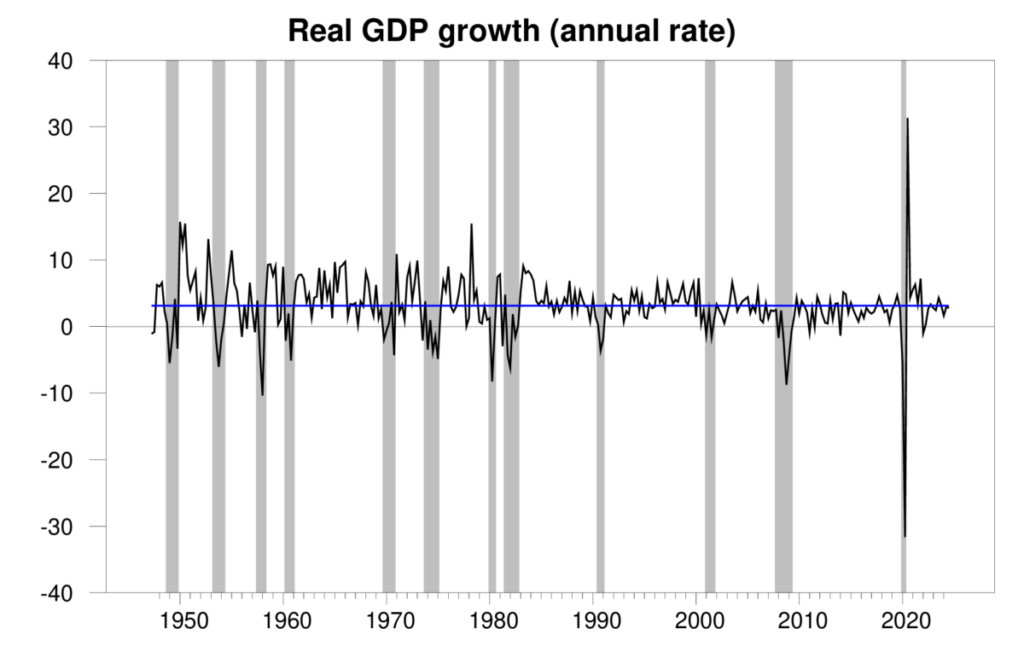
The Bureau of Economic Analysis announced today that seasonally adjusted U.S. real GDP grew at a 2.8% annual rate in the third quarter. That’s close to the long-run historical average of 3.1%. With inflation coming down, I think we now can declare that the Fed has achieved the admirable but difficult objective of a “soft landing” — bringing inflation down without tipping the U.S. into recession.

Quarterly real GDP growth at an annual rate, 1947:Q2-2024:Q3, with the historical average (3.1%) in blue. Calculated as 400 times the difference in the natural log of real GDP from the previous quarter.
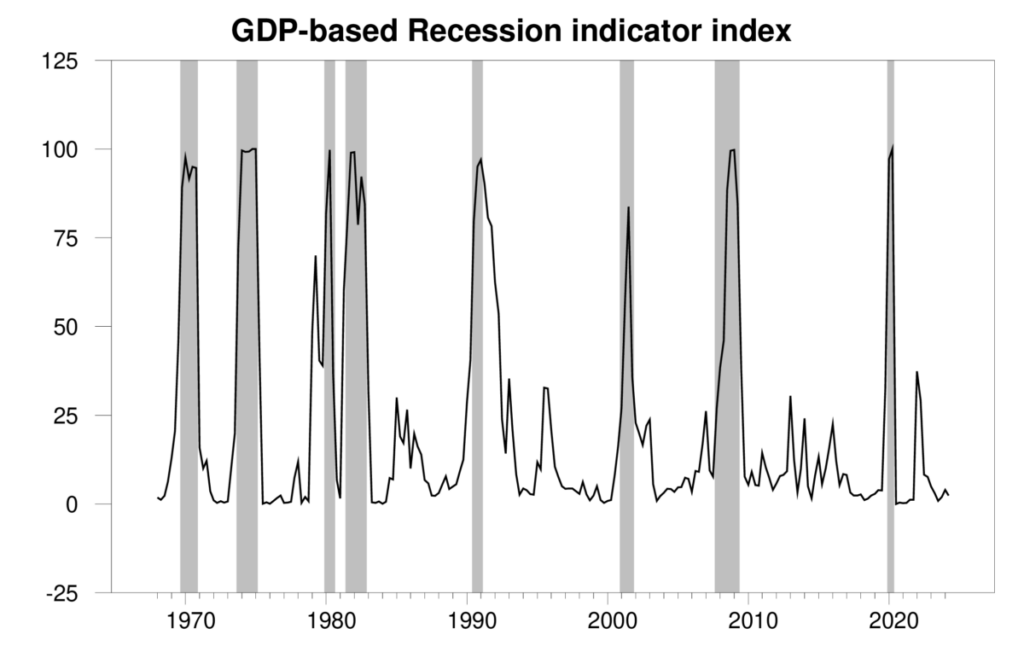
The new numbers put the Econbrowser recession indicator index at 2.4%. That’s quite a low number, and signals an unambiguous continuation of the economic expansion that began in 2020:Q3.

GDP-based recession indicator index. The plotted value for each date is based solely on the GDP numbers that were publicly available as of one quarter after the indicated date, with 2024:Q2 the last date shown on the graph. Shaded regions represent the NBER’s dates for recessions, which dates were not used in any way in constructing the index.
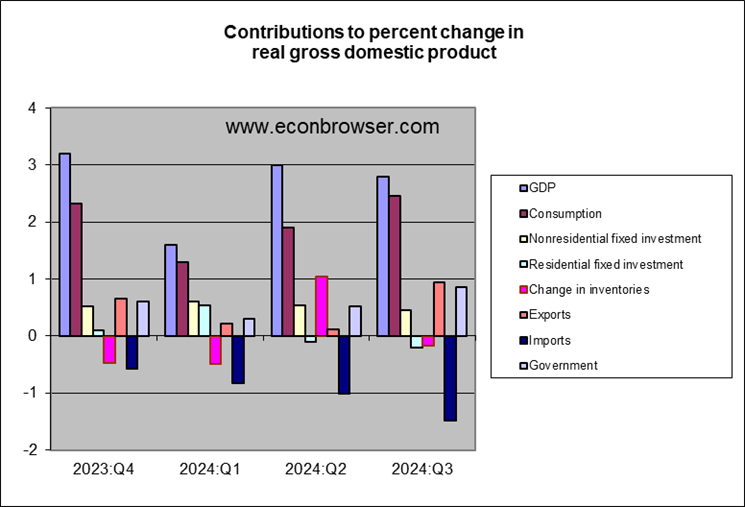
GDP growth was led by strong spending by consumers, who seem to be regaining confidence as employment growth continues strong. Third-quarter GDP was also boosted by a big increase in government spending associated with military assistance to Israel and Ukraine. A surge in imports, which are subtracted from GDP, held GDP growth back. Slower new home construction also subtracted from GDP growth, but not to the degree that we’d see if the Fed had engineered a big housing crunch.
Markets also breathed a sigh of relief this week that the military conflict in the Middle East does not look (for now) as if it’s going to lead to a big disruption in oil production or shipping. All this is enough to bring a smile back to the face of our Little Econ Watcher.
For now.


