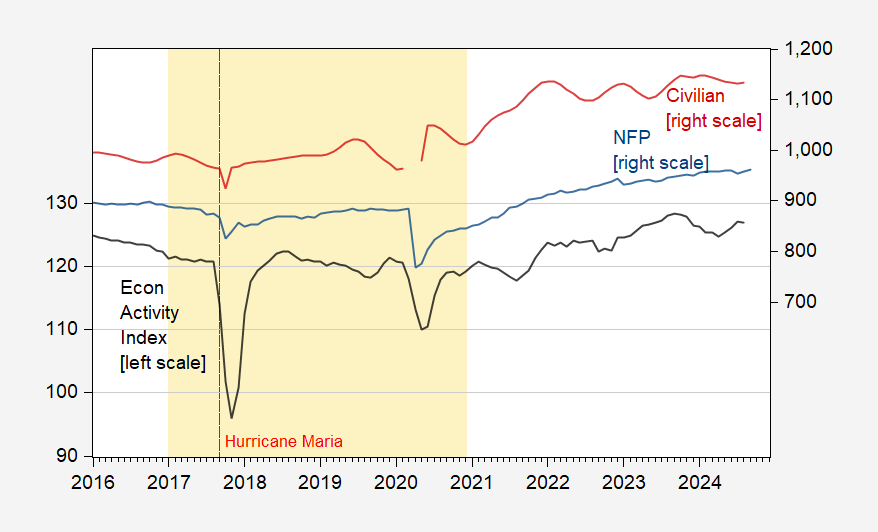
A reminder. Economic indicators, excess fatalities.
Figure 1: EDB of PR Economic Activity Index (black, left scale), nonfarm payroll employment, (blue, right scale), civilian employment (red, right scale), both in 000’s, s.a. Trump administration period shaded light orange. Source: EDB, FRED.
Lest we forget the disaster of the Trump FEMA response, here are several independent assessments: DHS OIG have document exactly how poorly FEMA performed. Other analyses have documented the differential response that occurred in the same period — that is much larger responses to hurricane landfalls in Texas and Florida.
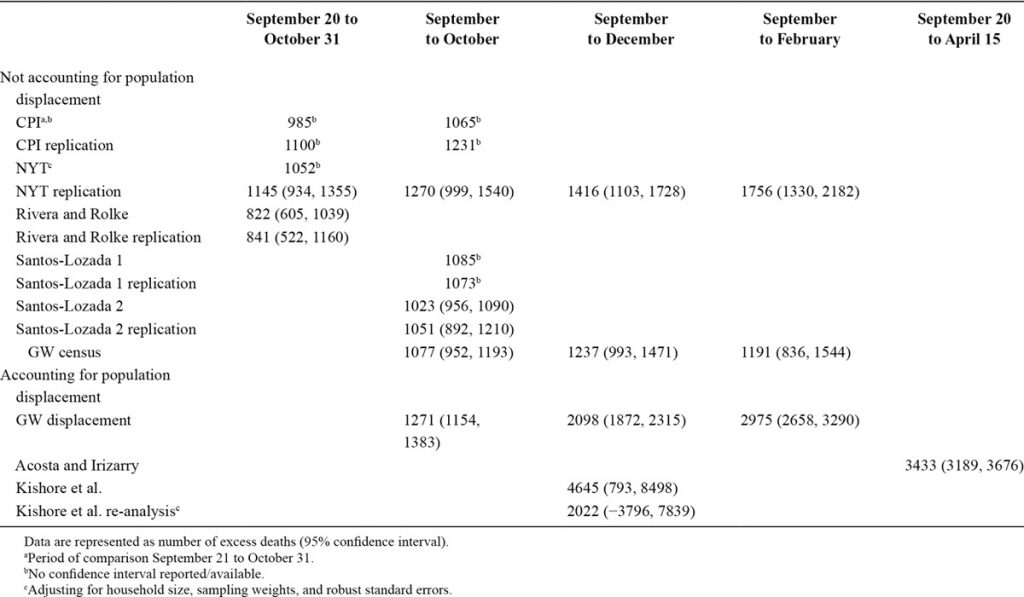
From Sandberg, et al. (July 2019) in Epidemiology:


