CPI comes in above consensus, on both headline and core. Instantaneous inflation (per Eeckhout (2023)) has a slight uptick.
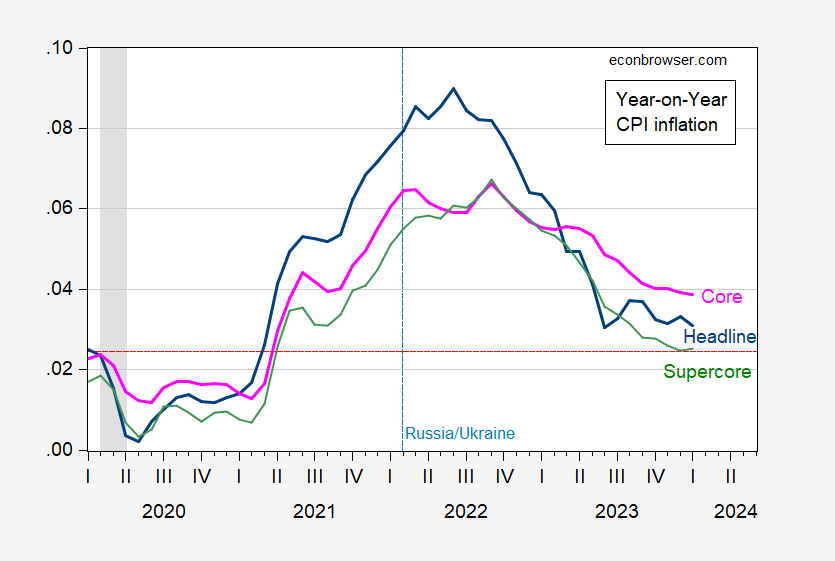
Figure 1: Year on Year CPI inflation (blue), core CPI inflation (pink), supercore CPI inflation (green), %, decimal form. NBER defined peak-to-trough recession dates shaded gray. Red dashed line is implied CPI inflation rate consistent with 2% PCE inflation rate. Source: BLS, NBER, and author’s calculations.
Supercore CPI includes all items less food, shelter, energy, and used cars and trucks.
While the year-on-year inflation rate is convention, it upweights the distant past rendering it sensitive to including or excluding initial month’s CPI. For an alternative measure which shows some kind of trend, I show instantaneous inflation for the same categories, using Eeckhout‘s formula (T=12, a=4).
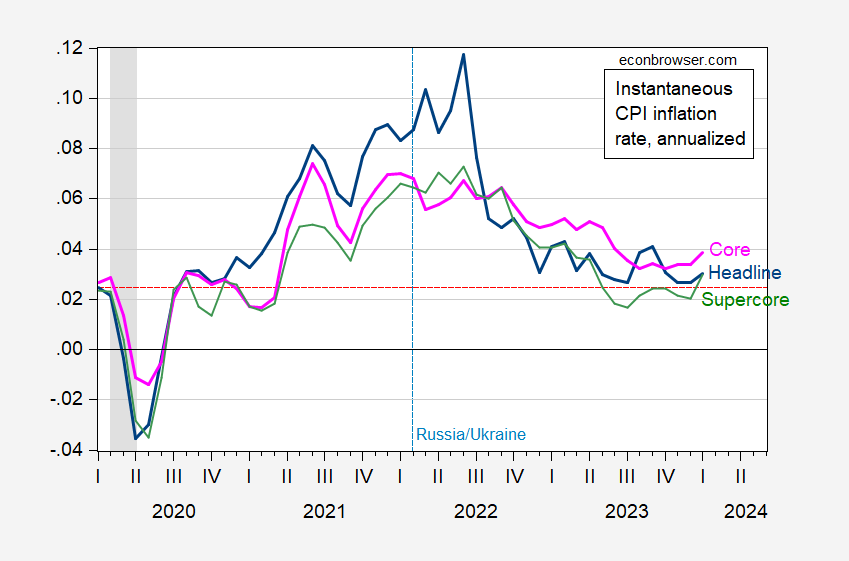
Figure 2: Instantaneous CPI inflation (blue), core CPI inflation (pink), supercore CPI inflation (green), %, decimal form, per Eeckhout (T=12, a=4). NBER defined peak-to-trough recession dates shaded gray. Red dashed line is implied CPI inflation rate consistent with 2% PCE inflation rate. Source: BLS, NBER, and author’s calculations.
Note that by headline CPI inflation, we’re close to the Fed’s target; that’s true also for supercore.
Some of the surprise was driven by owner equivalent rent, which suggests that upward pressure on inflation might be more persistent, given the rebound in house prices.