Forecast errors from end of last year are essentially zero.
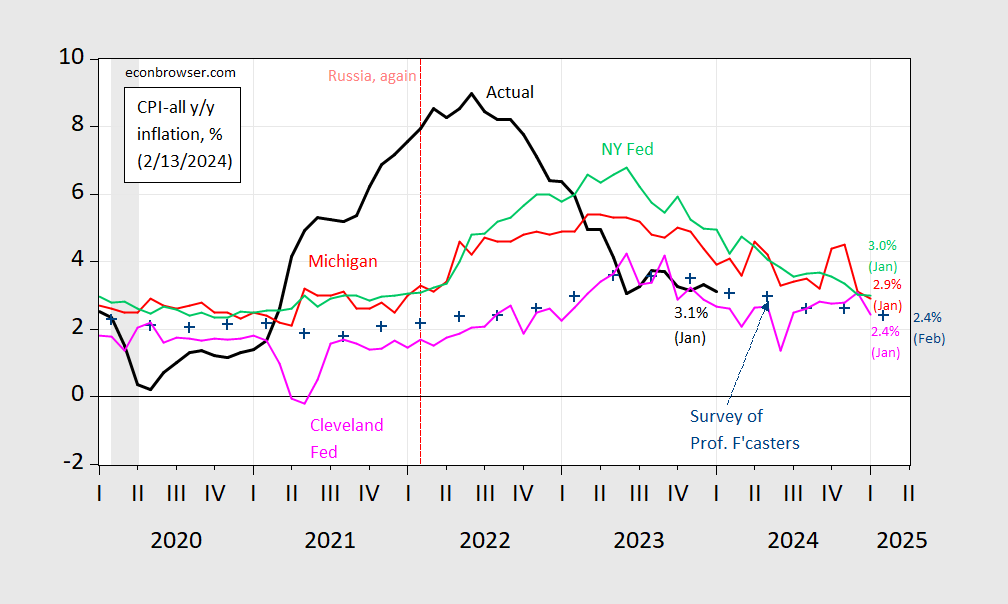
Figure 1: CPI inflation year-on-year (black), median expected from Survey of Professional Forecasters (blue +), median expected from Michigan Survey of Consumers (red), median from NY Fed Survey of Consumer Expectations (light green), forecast from Cleveland Fed (pink), all in %. NBER defined peak-to-trough recession dates shaded gray. Source: BLS, University of Michigan via FRED and, Philadelphia Fed Survey of Professional Forecasters, NY Fed, Cleveland Fed and NBER.
Who was over-estimating inflation a year ago?
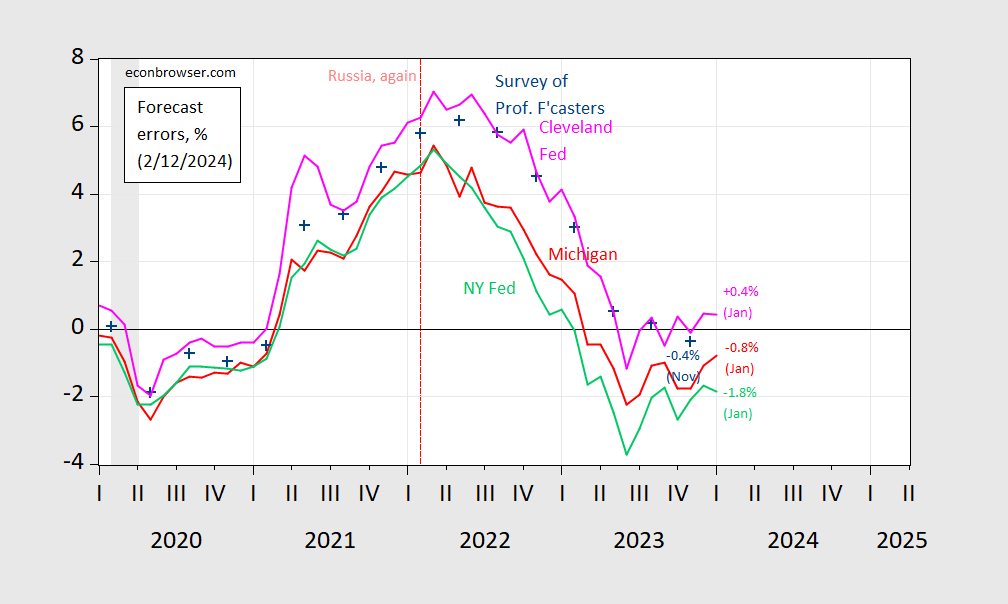
Figure 2: Forecast errors from Survey of Professional Forecasters (blue +), from Michigan Survey of Consumers (red), NY Fed Survey of Consumer Expectations (light green), Cleveland Fed (pink), all in %. NBER defined peak-to-trough recession dates shaded gray. Source: BLS, University of Michigan via FRED and Investing.com, Philadelphia Fed Survey of Professional Forecasters, NY Fed, Cleveland Fed , NBER and author’s calculations.
While the SPF and Cleveland Fed measures underpredicted inflation through 2021-22, they are about on track as of November/December. In contrast, the household measures overpredicted inflation.