From a lecture prepared for “Macroeconomic Policy” (Spring 2024):
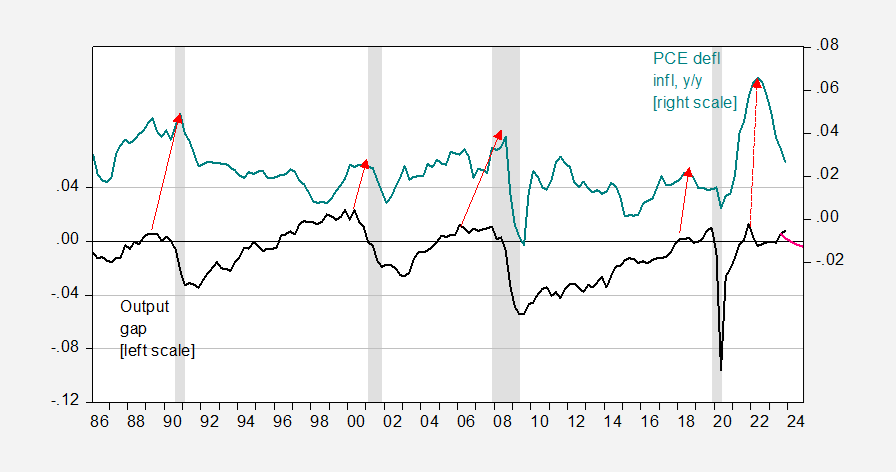
Figure 1: Output gap (black, left scale), CBO projected output gap (pink, left scale), and PCE deflator y/y inflation (teal, right scale). NBER defined peak-to-trough recession dates shaded gray. Source: BEA 2023Q4 advance, CBO Budget and Economic Outlook, Feb 2024, NBER, and author’s calculations.
The large increase in inflation seems quite outsized compared to the relatively small positive output gap.
A more formal argument by Adam Shapiro (SF Fed) here.