[ad_1]
Today, we are pleased to present a guest contribution written by Joshua Aizenman (University of Southern California) and Jamel Saadaoui (Université Paris 8-Vincennes). This post is based on the paper of the same title.
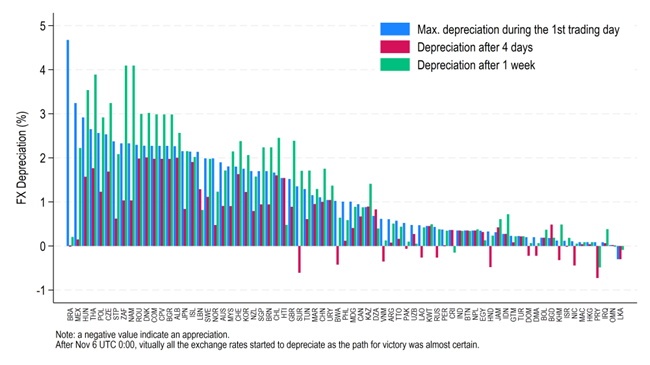
The outcome of the 2024 US presidential election has resonated all around the world. On the exchange rate markets, virtually all the exchange rates of countries that are not pegged depreciated against the USD around midnight November 6, 2024, when the outcome of the election was certain. To understand better the factors accounting for these depreciations, we compute three measures of exchange rate depreciations: first, the maximum depreciation during the 1st trading day after November 6 UTC 0:00 to capture the reaction on the FOREX immediately after the news the maximum depreciation during the first trading day; second, the depreciation after 4 days to capture the reaction of monetary authorities and financial markets to the shock; third, the depreciation 1 week after the shock to observe whether some exchange rates experienced a further depreciation or a return to the pre-shock exchange rate level. Figure 1 plots the patterns of these 3 depreciations. Notably, the exchange rate movement observed immediately after the 2024 US election has not been reversed one week later. In 26 countries out of a sample of 73 bilateral exchange rates against the US Dollar, the depreciation after 1 week was even more pronounced than just after the election. Among them, we find South Africa, Thailand, Hungary, Czech Republic, Romania, Bulgaria, and Poland, as the countries with the largest differences. These movements are at the heart of policymakers’ discussions, as they create instability, especially for emerging markets.
Figure 1. Exchange rate movements in the aftermath of the 2024 US election
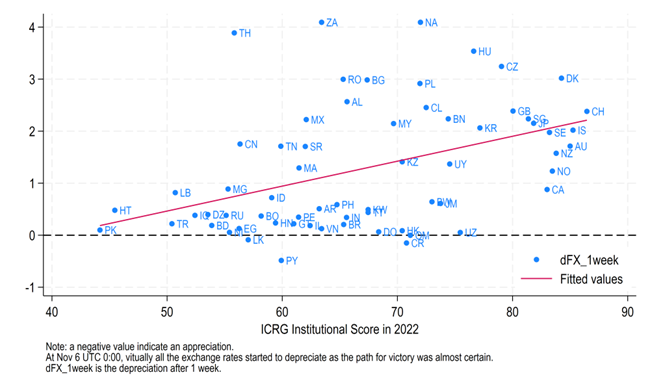
The outcome of the 2024 US election offers us a quasi-natural experiment to test the resilience of countries to exchange-rate market pressures. Indeed, due to the nature of the Republican platform and thanks to the use of high-frequency data, we can identify the factors that explain the cross-sectional differences in currency returns against the US Dollar. In Figure 2, we plot the exchange rate movements against the USD one week after the news against the ICRG institutional score, a broad measure of the quality of institutions created and maintained by the PRS group. For our sample of 73 currencies against the USD, we find that the correlation between the depreciation rate and the institutional score is clearly positive around 40 percent, and significant at the 1 percent level. This correlation may indicate that the market expects that the new US administration will be more favorable or at least more neutral vis-à-vis countries with political regimes that are less cautious about several dimensions of institutional development, like the respect of property rights, the central bank independence, the transparency of monetary and fiscal policy, democratic accountability of the economic policy decisions and so on.
Figure 2. Correlation between institutions and exchange rate movements
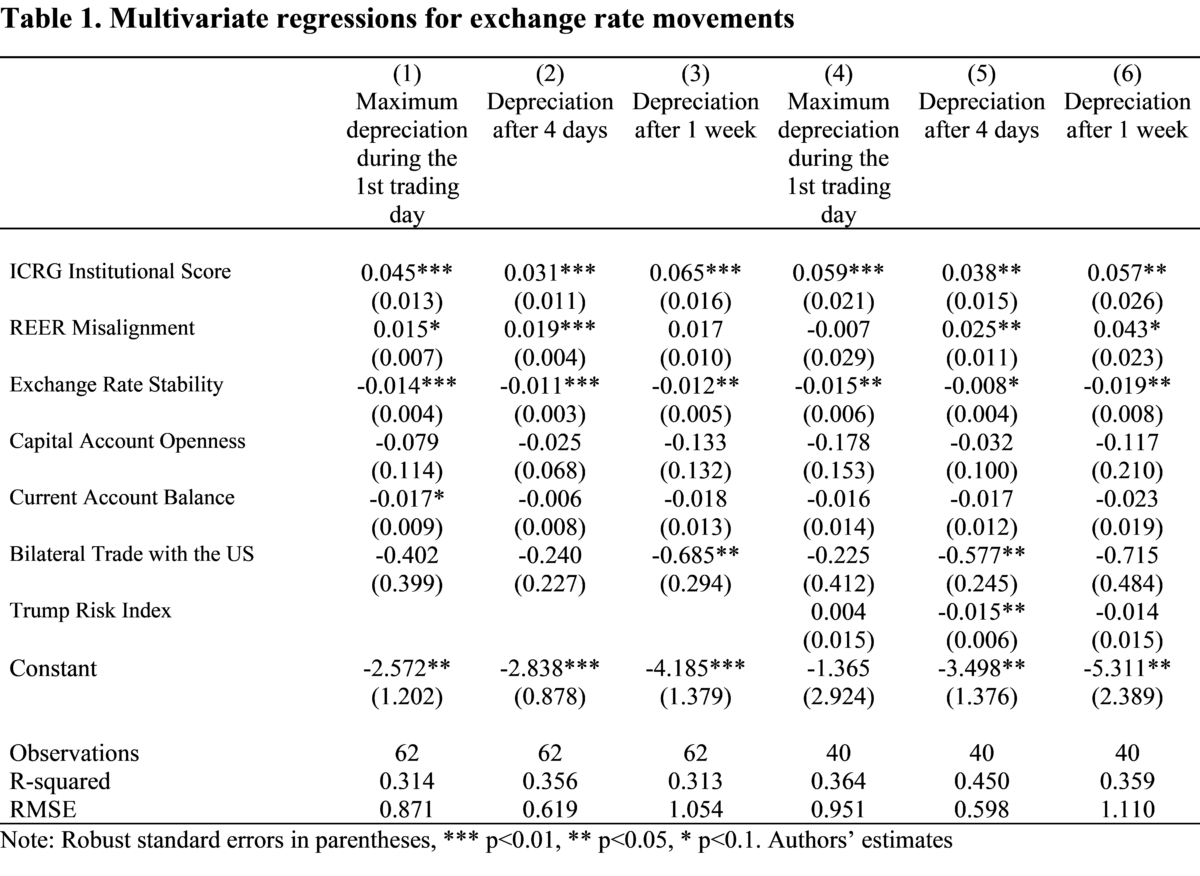
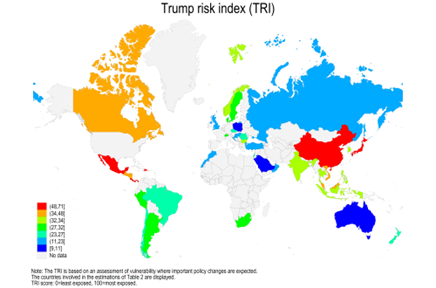
In order to achieve more reliable estimates, we run multivariate regressions, controlling for a vector of relevant confounding variables. Table 1 offers multiple insights. First, countries with better institutions experience stronger depreciation. Second, exchange rate interventions (proxied by exchange rate stability scores) have helped to stabilize the currencies at all time horizons. Third, misalignment of the real effective exchange rate contributes to the exchange rate depreciation only after 4 days. This coefficient can reflect an error-correction mechanism, as overvalued currencies are expected to depreciate in the future. Fourth, the bilateral trade surplus with the US contributed to the depreciation after 4 days. Higher exposure to the risk linked to expected changes in the US policy, measured by the EIU’s Trump Risk Index (see Figure 3), contributes to limiting the depreciation after 4 days. This possibly reflects the observation that most exposed economies have experienced the largest movements immediately after the shock (in line with dynamics suggested by Larson and Madura, 2001. ‘Overreaction and underreaction in the foreign exchange market.’ Global Finance Journal).
Figure 3. The Trump Risk index
Source:The Economist.
This post written by Joshua Aizenman and Jamel Saadaoui.
[ad_2]
Source link


