[ad_1]
Only one forecaster projects two consecutive quarters of negative growth.
Here’s the WSJ mean forecast compared to nowcasts:
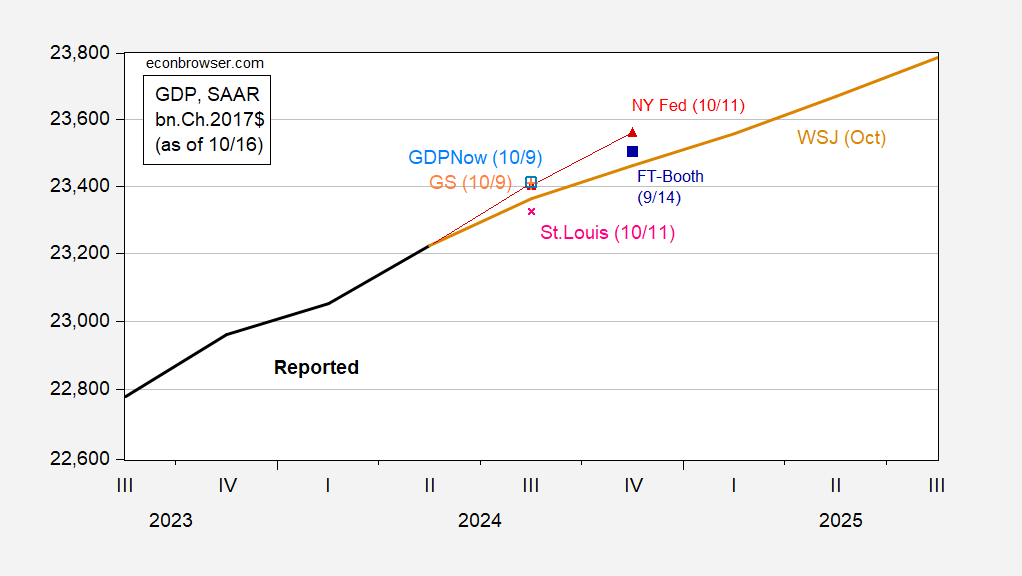
Figure 1: GDP (bold black), WSJ October survey mean (tan), GDPNow as of 10/9 (light blue square), NY Fed nowcast as of 10/11 (red triangles), St Louis Fed news nowcast as of 10/11 (pink x), Goldman Sachs tracking as of 10/9 (green +), FT-Booth as of 9/14 iterated off of 3rd release (blue square), all in bn.Ch.2017$ SAAR. Levels calculated by iterating growth rate on levels of GDP, except for Survey of Professional Forecasters. Source: BEA 2024Q2 3rd release, Atlanta Fed, NY Fed, Philadelphia Fed, WSJ October survey, and author’s calculations.
The WSJ mean forecast is slightly less optimistic than the FT-Booth mean forecast, and substantially less optimistic than the nowcasts from Atlanta and NY Feds, and Goldman Sachs. Interestingly, the 20% trimmed top/bottom bounds are pretty narrow, reflecting little disagreement about short term growth prospects. The only prediction of two consecutive quarters of negative growth comes from Andrew Hollenhorst and Veronica Clark of Citigroup -0.9 and -1.5 q/q AR in 2024Q4-2025Q1).
The level of GDP is forecasted to be much higher, mostly because of the annual update has shifted up the contour of GDP, and because the near term growth (Q3-Q4) is increased by 0.8 and 0.3 ppts respectively.
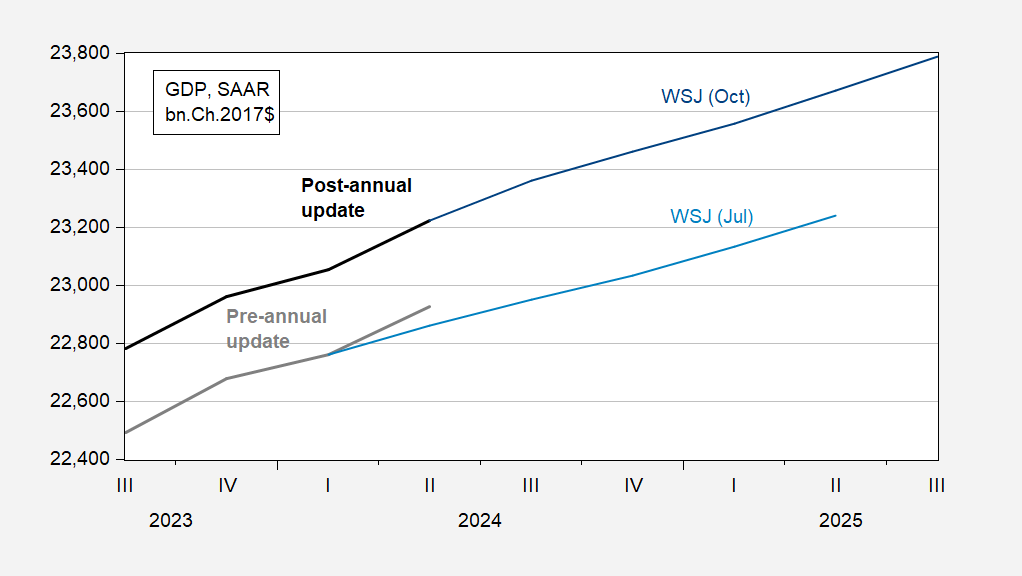
Figure 2: GDP, post-annual update (bold black), WSJ October survey mean forecast (blue), GDP, pre-annual update (bold gray), WSJ July survey mean forecast (light blue), all in bn.Ch.2017$, SAAR. Levels calculated by iterating off relevant GDP level. Source: BEA, WSJ, and author’s calculations.
Recession probability estimates continue to decline.
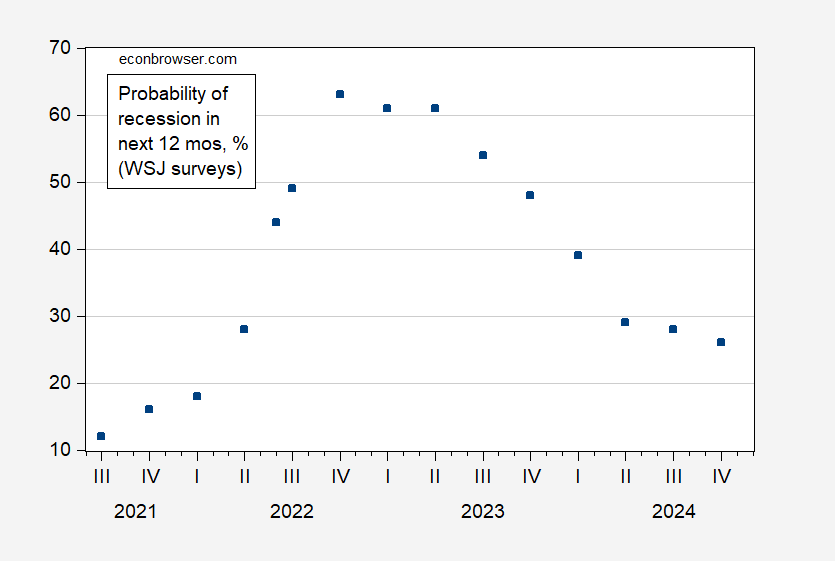
Figure 3: Probability of recession within the next 12 months , % (blue square). Source: WSJ.
More results in the article.
[ad_2]
Source link