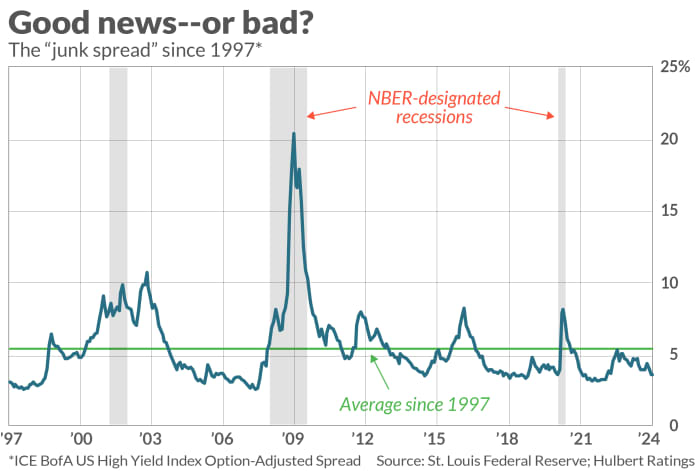
The “junk spread” is abnormally low right now, and that elevates the risk of an imminent recession. The junk spread is the difference between the yield on corporate high-yield bonds and U.S. Treasurys of comparable maturities. This spread represents the extra yield that investors demand to compensate them for the additional risk of investing in junk bonds rather than Treasurys.

The spread currently stands at 3.5 percentage points, well below its average since 1997 of 5.4 percentage points, as shown in the chart above. That means investors believe economic risk to be abnormally low right now, which is hardly surprising given the widespread consensus that the U.S. Federal Reserve has perfectly executed the proverbial soft landing.
Nevertheless, as Humphrey Neill, the father of contrarian analysis, reminded us, “When everyone thinks alike, everyone is likely to be wrong.” Contrarians believe that the low current spread represents an excess of exuberance that will correct itself in coming months.
History provides strong support for this contrarian belief, as the table below shows. The results reported are based on one of the market’s standard ways of measuring the spread, the ICE BofA U.S. High-Yield Index Option-Adjusted Spread.

The differences shown in the chart are significant at the 95% confidence level that statisticians often use when determining whether a pattern is genuine. The junk spread is currently in the lowest historical quintile, represented by the first row of the chart, and that’s why contrarians conclude there is an elevated risk of a recession. Increases in the junk spread of 1.9 to 4.8 percentage points over a one- to two-year period would not only reflect increased economic risk but would also contribute to that increase.
“The junk-bond spread has greater explanatory power in the one- to three-year horizon.”
A longer-term contrarian indicator
Contrarians therefore should add the junk spread to the set of sentiment indicators on which they focus when assessing the mood of investors. One advantage this indicator has over most others is that its greatest explanatory power is for the much longer term. Most other sentiment indicators tell you little about the market beyond a one- to three-month horizon. The junk-bond spread, in contrast, has greater explanatory power in the one- to three-year horizon.
On the one hand, you might take some solace from this longer explanatory horizon, since it means a recession doesn’t have to begin in the next several months. On the other hand, this analysis suggests this heightened risk of a recession is not going away soon.
That doesn’t guarantee that a recession will occur, of course. But it would be entirely consistent with contrarian theory for a recession to begin just as the market is celebrating a soft landing.
Mark Hulbert is a regular contributor to MarketWatch. His Hulbert Ratings tracks investment newsletters that pay a flat fee to be audited. He can be reached at mark@hulbertratings.com.
More: The stock market’s ‘bad breadth’ is making even stalwart bulls nervous
Also read: Here’s what to expect from stocks in February after January’s big rally


