[ad_1]
The Bureau of Economic Analysis announced today that seasonally adjusted U.S. real GDP fell at a 0.3% annual rate in the fourth quarter. One can make excuses for the number, but I’m not feeling optimistic.
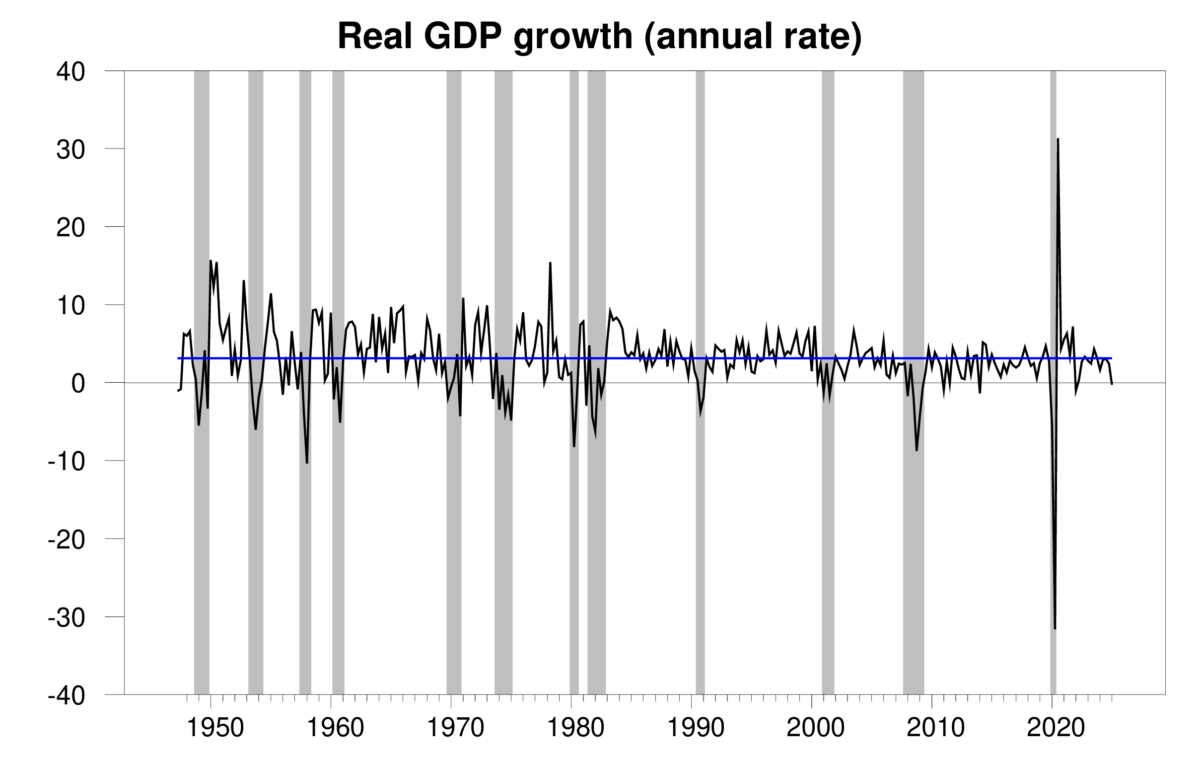
Quarterly real GDP growth at an annual rate, 1947:Q2-2025:Q1, with the historical average since 1947 (3.1%) in blue. Calculated as 400 times the difference in the natural log of real GDP from the previous quarter.
The new numbers bring the Econbrowser recession indicator index up modestly to 6.8%. Note this is an assessment of where the economy was in the previous quarter, namely 2024:Q4. Since we started reporting this in 2005, Econbrowser reports this measure with a one-quarter lag to allow for data revisions and to aid the algorithm in pattern recognition. A value of 6.8% by itself is not that alarming.
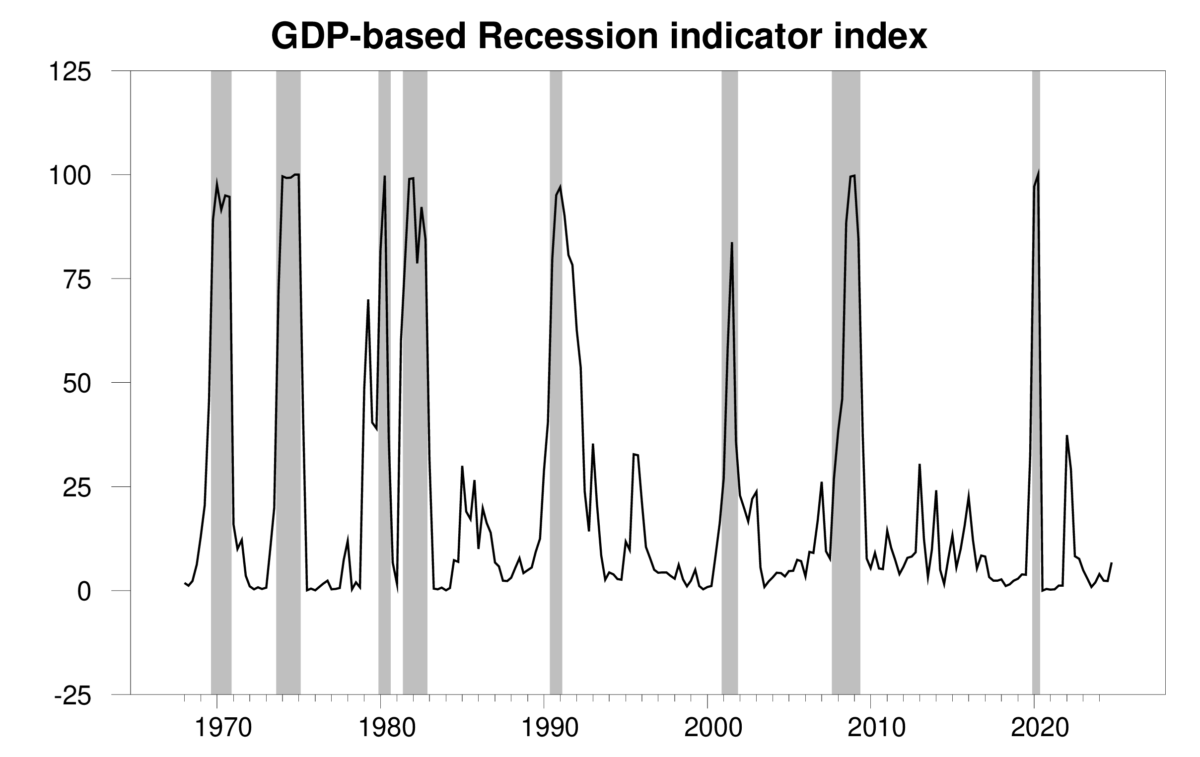
GDP-based recession indicator index. The plotted value for each date is based solely on the GDP numbers that were publicly available as of one quarter after the indicated date, with 2024:Q4 the last date shown on the graph. Shaded regions represent the NBER’s dates for recessions, which dates were not used in any way in constructing the index.
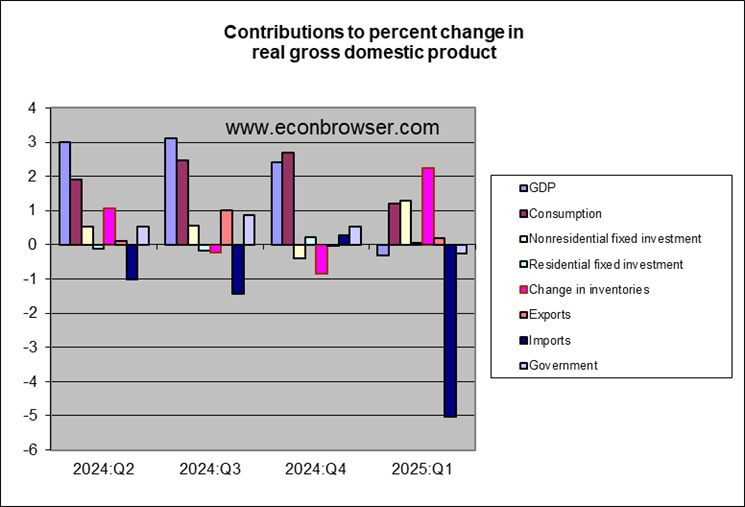
The fall in real GDP was caused by a huge surge in imports. These are subtracted from GDP and presumably reflected businesses trying to stockpile items before tariffs drive their prices up. We also see a surge in inventories, consistent with the stockpiling interpretation. Apart from this, one could take some solace in the strength of nonresidential fixed investment.
But I find it hard to see a positive in the fact that people are running to protect themselves from what’s coming around the bend. In a 2018 paper in the Review of Economics and Statistics, I noted that the two-year percentage change in the number of people on nonfarm payrolls often provides an early indication of an incipient business contraction. The 2-year growth rate has definitely slowed down, as it does as any expansion matures, though the sharp deceleration that often marks the months just before a recession has not yet set in.
Red line: 100 times the two-year change in the natural logarithm of end-of-quarter seasonally adjusted nonfarm payrolls, 1949:Q1 to 2025:Q1. Black line: two-year-ahead forecast error for predicting 100 times the log of end-of-quarter nonfarm payrolls, 1949:Q1 to 2025:Q1. Updates Figure 5 in Hamilton (2018).
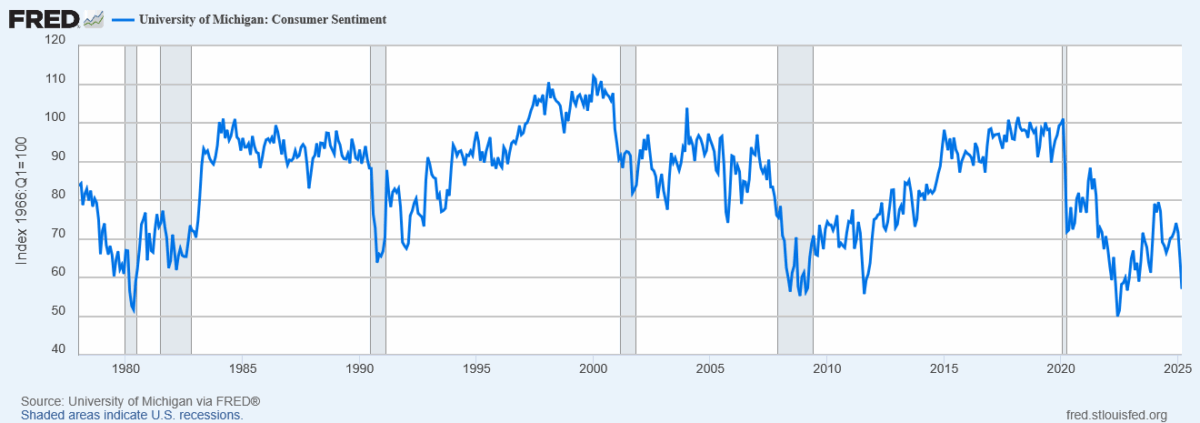
Consumer sentiment offers another warning sign.
In my view, new initial claims for unemployment insurance are the single most reliable indicator of the early stages of a recession. These still look fine.
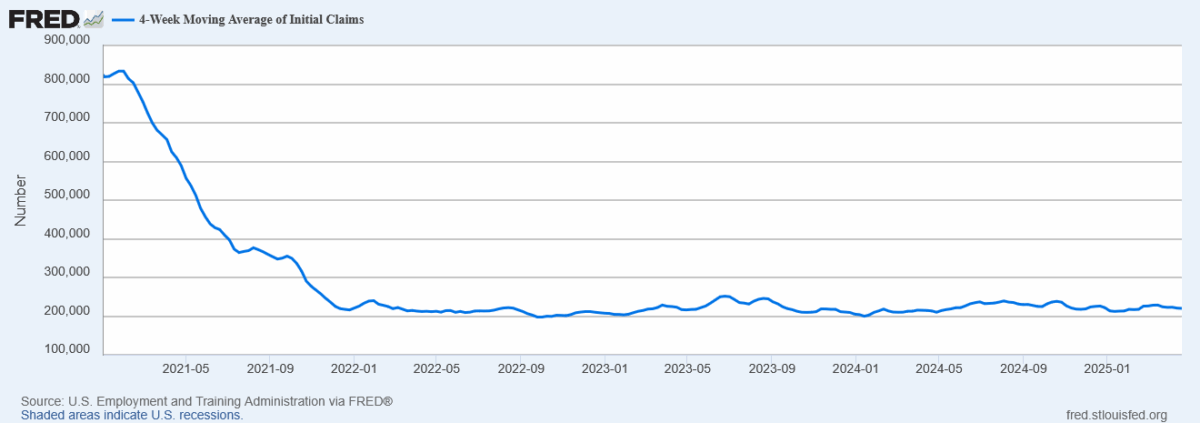
4-week average of initial claims, Jan 2, 2021 to Apr 19, 2025.
All this is not enough to ring the fire alarm. But it does bring a frown to our Little Econ Watcher.
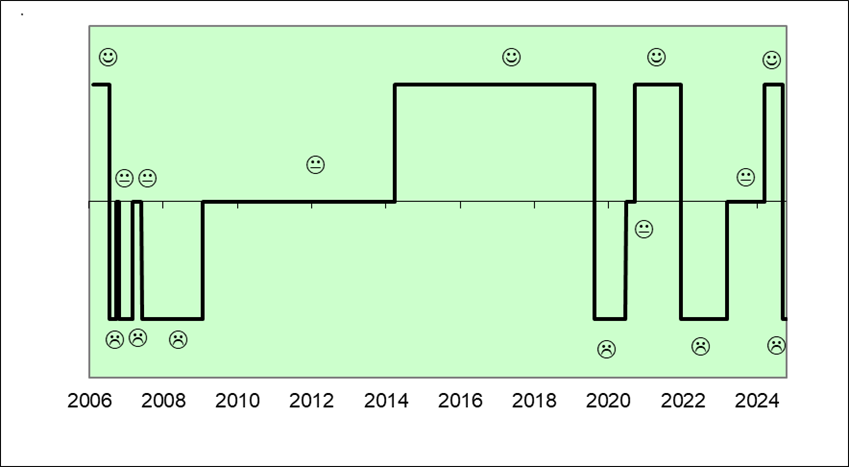
In the words of Bob Dylan, it’s not dark yet, but it’s getting there.
[ad_2]
Source link