Data available as of today:
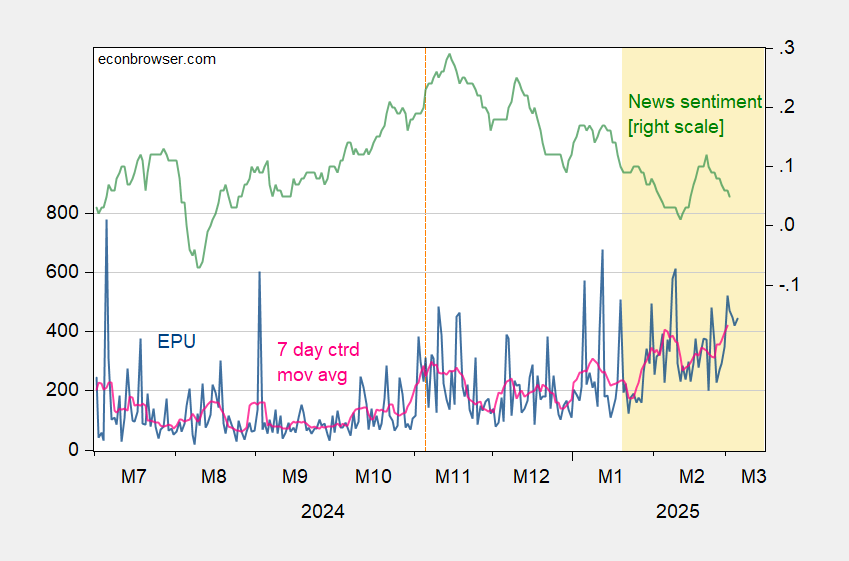
Figure 1: EPU (blue, left scale), and centered 7 day moving average (red, right scale), SF Fed News Sentiment index (green). Source: policyuncertainty.com, SF Fed, and author’s calculations.
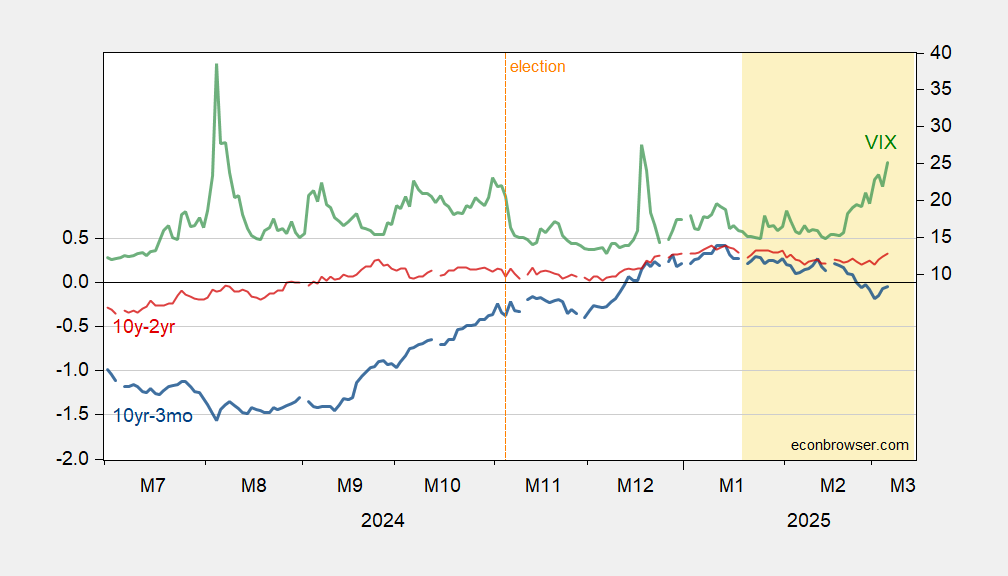
Figure 2: 10yr-3mo Treasury term spread (blue, left scale), 10yr-2yr Treasury term spread (red, left scale), both in %, VIX at close (green, right scale). Source: Treasury, CBOE via Treasury.